With the conference regular season coming to a close, what a 'perfect' time to post a study of conference regular season results and how they foretell outcomes in the NCAA tournament. I personally believe that the conference regular season is the most important component of a team's resume. It's roughly a ten-week, two-game-per-week gauntlet against the teams with which you are most familiar. A game plan can be put together for any opponent on the schedule, but when you know an opponent inside-and-out, their strengths and weaknesses, their tendencies and values, all from the 1-3 schedule-collisions each and every year, the game plan goes to a deeper level. Surely, the in-depth understanding between conference opponents and the results from their contests should reveal valuable insights into the true quality of those teams, and that's what I hope to extract with this study.
OBJECTIVE
The question I propose with this model: What if teams were seeded in a logical accordance with conference standings? Suppose the outright winner of the conference regular season earns a 2-seed in the NCAA tournament, but the team in second place earns a 1-seed (perhaps because of a stronger non-conference schedule and/or a claim to the conference tournament title). Does this deviation from conference results -- where the conference winner would get a 1-seed and the second-place team would get a 2- or 3-seed -- portend anything for the NCAA tournament?
INSIGHT
Before I delve into the logic behind this approach and use examples to demonstrate it, I want to discuss the limitations of the approach.
The first inherent problem is unbalanced conference schedules. With the exception of the Big 12 and the Big East, most conferences only play 18-20 games in a 12+ member conference, which means there are teams that will meet only once and one of those teams will have home-court advantage in that match-up. I can further illustrate the impact of this imbalance with the UK/IOWA example below.

In UK's conference schedule, all of their away-only match-ups were against above-.500 teams and all of their home games were against below-.500 teams. If I was a coach, I would want the schedule to be the other way around: I would want my easy games at the opponent's place and my hard games at my place. In fact, one could argue that UK lost the regular season title because the only game against AUB was away at AUB. If it was at UK, it's likely UK goes 15-3 and AUB goes 14-4. On the other hand, we have IOWA. Ten of their twenty conference games were against below-.500 teams, against which IOWA amassed a 9-1 record. Against all other teams, IOWA is simply 3-7 (two of those being against 11-9 teams). Granted, you can argue that three of the Top 5 teams were played only on the road, which is unfair to IOWA, but getting nine of your twelve overall wins against sub-.500 competition to claim a tie for fourth is unfair to the rest of the conference who may have got the same record against tougher competition. The point I am concerned about for this model is how the imbalance in conference schedule can lead to distortions in conference records and standings, as this example shows. For the record, I did not investigate the quality of schedule/record for the results of this article, but if the model continue to show predictive value, I will dig deeper at a later time.
The second problem, which is a more recent problem, is unfinished conference schedules. 2021 was a wild regular season, with many teams cancelling games to virus concerns. 2022 was less disrupted by this phenomenon, but there was still notable instances where cancellations severely affected conference standings and results. The most notable example is PROV from the Big East. They finished 14-3 in first place with three games cancelled while NOVA finished 16-4 in second place. If PROV plays those three games -- home against 3rd place and away at fourth and fifth -- it's likely they go 1-2 against those three opponents, putting them clearly in second place or worse. For the record, I ignored the outcomes produced by game cancellations: No over-seed/under-seed interpretations were made for these teams. (It's also why I will be using 2021 as the examples in this article because I have no choice but to cherry-pick 2021's examples due to game cancellations.)
The third problem with this model is the interpretation itself: Do I assign the over-seed to one team or do I assign the under-seed to the other team? In the hypothetical example at the start, if I assign the over-seed to the second-place team that received a 1-seed, it suggests that team will fall short of seed-expectations (which would be missing the F4), but on the other side, if I assign the under-seed to the first-place team that received a 2-seed, it suggests that team will meet or exceed seed-expectations (which would be at least reaching the E8). I never assign a label to both teams involved because OS/US models operate on the assumption that at least one team is properly seeded. For the record, when compiling the data for this model, I assigned OS or US labels with hindsight information (I knew the result beforehand and assigned the label based on information I would not have had if I had assigned it at the start of the respective tournament).
METHODOLOGY
Now, we get to the fun part. Here are the rules to the logic, with 2021 used as examples:
- If two teams have the same record but not the same seed, either the higher-seeded team is over-seeded or the lower-seeded team is under-seeded. Examples: CLEM, OU
- If two teams have the same seed but not the same record, either the better-record team is under-seeded or the worse-record team is over-seeded. Example: OHST
- If a team with a worse conference standing receives a higher seed than another team with a better conference standing, either the worse-standing team is over-seeded or the better-standing team is under-seeded. Example: TENN
- If the rate of change in wins breaks a proportional rate of change in seeding in an excessive manner, then either the higher-seeded team(s) is over-seeded or the lower-seeded team(s) is under-seeded. Example: 2021 B10-group.
- If the rate of change in wins breaks a proportional rate of change in seeding in a tight manner, then either the higher-seeded team(s) is under-seeded or the lower-seeded team(s) is over-seeded. Example: 2021 B12-group.

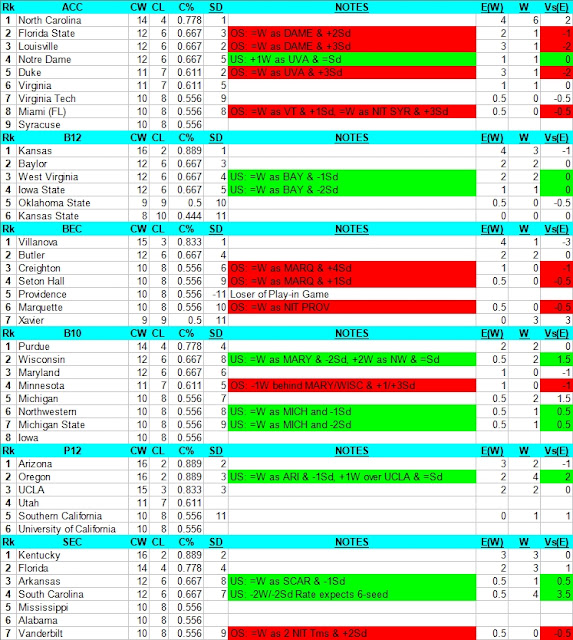
Before I show the results of 2016-19, I do want to explain the short-hand notation on the chart.
- US or OS - Under-Seed or Over-Seed Label
- +1W over COL & -1Sd is read as "One more win than COL (or insert team here) but seeded one seed-line lower than them"
- Even though USC is given the "US" label ex post facto, when doing US/OS analysis before the tournament starts, the actual notation would be "Either COL is over-seeded because its record is worse but its seed is better than USC or USC is under-seeded because its record is better than and its seed is worse than COL. In the case of 2021, both met or exceeded seed-expectations for wins (the column E(W)), thus USC must have been under-seeded.
- In the notes column, the "US" label is always given a green color-code and the OS label is always given a red color-code. In the Vs(E) column, if performance versus expectations is 0 or positive, it is color-coded green, and if performance versus expectations is negative, it is color-coded red. Thus, when there is Green in notes and Green in Vs(E), then the model predicted correctly, when there is Red in notes and Red in Vs(E), then the model predicted correctly, and when the two are opposite-colored, then the model predicted incorrectly.
RESULTS

For this section, I think the easiest approach is to examine the results in summary, then show the charts for the years 2016-2019. In the years 2021, 2019, and 2017, the model did exceptionally well, producing a 27/28 accuracy (96.4%) for OS predictions and a 21/22 accuracy (95.45%) for US predictions. In 2018 and 2016, it was far less accurate with 18/32 (56.25%). The most logical explanation for this inaccuracy is over-load (an imbalance between the quantity of OS labels to US labels). This explanation is borrowed from the Poll-based OSUS model in the previous article. In a bracket structure where someone has to win, if two over-seeds are paired against each other, one must advance even though the model says they should both lose. If an 8-seed and a 9-seed expect to win 0.5 games and both are OS labels, one has to win regardless of what the model wants and as a result exceeds seed-expectations. With a healthy OS/US balance (10/7, 9/6 or 9/9), the probabilities of this "forced advancement of mediocrity" is reduced. Now, let's see the years 2016-2019.
2019

2018

2017
2016

CONCLUSION
As for what the Conference-based OSUS model has in store for 2022, we will have to wait until the Selection Show on Sunday Mar 13 for our seeds. Early bracket projections show major discrepancies for the ACC, B10 and SEC.
As for the article itself, I had three models (this one included in the three) using conference results, but at the last minute, I decided against the other two because they felt more subjective in application than practical. I might include the results of the other two models in my BCW write-up under the heading "High-risk strategies." As always, thanks for reading my work, and you'll be hearing from me more often than bi-weekly over the next ten days, so let's do this!
No comments:
Post a Comment