Foundations of the EPM
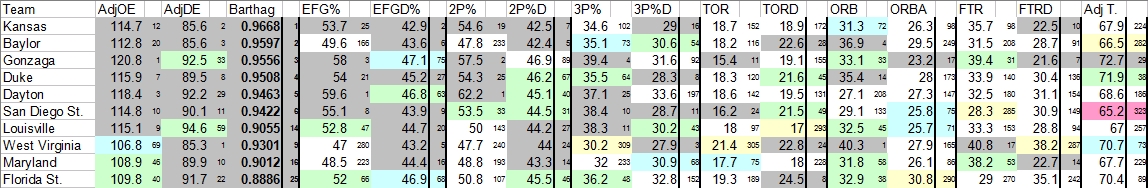
As usual with my micro-analysis work, it starts with Dean Oliver's Four Factors: Field Goal Percentage, Rebounding Percentage, Turnover Rate, and Free Throw Rate. Below is a table of pre-tournament data and Torvik Ratings for all 1-seeds from the 2008-2019 NCAA tournaments (collected from Bart Torvik's website).

If you try to answer the same question that I attempted to answer, you will uncover the same patterns that I uncovered: 2018 UVA struggled to get easy points. So where do teams get easy points?
- Field Goal Percentage (EFG%, 2P%, and 3P%): For the record, there is no substitute for good shooting. Either a team can shoot the ball or they cannot shoot the ball. Of the nine 1-seed National Champions, five had an EFG% ≧ 55.7%, and the four that did not made up for it with dominance in one or more of the other factors. Of the thirty-nine 1-seeds that did not win the national championship, only fourteen (14/39 = 35.9%) had an EFG% ≧ 55.0%.
- Offensive Rebounding Percentage (ORB): Higher percentage shots come closer to the rim than farther away, and this is where most offensive rebounds happen (unless you are playing trashketball). It is probably no coincidence that every 1-Seed National Champion had a Top-17 rank in OR% from 2008-2017. Of the thirty-nine non-champion 1-seeds, only eleven (11/39 = 28.2%) had this quality. Only in the last two years (2018 and 2019) have 1-seeds cut down the nets with 100+ rankings in OR%. In 2018, all four 1-seeds had this trait, and the two F4 teams without a 1-seed (MICH and LOYC) also had this trait. For the record, OR% as a whole has been in a consistent downtrend in college basketball over the time period of this study.
- Turnover Rate (TOR): A possession can end one of three ways -- a shot attempt (miss or make), a free throw, or a turnover. Only one these three does not produce points. In fact, the same one that does not produce points for that team can actually produce easy points for the opposing team. Denying your team an opportunity to score points while simultaneously providing your opponent an opportunity to score easy points is a simple recipe for losing. Only one 1-seed champ produced a TO% rank higher than 44th, and this team made up for it with dominance in forcing turnovers on their opponent, resulting in easy points for them. Of the thirty-nine non-champ 1-seeds, eighteen (18/39 = 46.15%) had a TO% rank 44th or better nationally, and all four 1-seed National Runner-ups fit this mold. Take care of the rock because twelve out of thirteen title-game participating 1-seeds did!
- Free Throw Rate (FTR): Despite my objections to the usefulness of this advance metric, I did include it in this study. However, you can see for yourself that FTR has no discernible pattern in predicting 1-seed success or failure. Six of the nine 1-seeds with the highest FTR did not advance past the R32, which is contrary to logical expectations. In fact, FTRD is far more useful than FTR (which is also the case in the NBA) when making predictions. Of the nineteen 1-seed F4 participants (F4, NR and NC combined), fifteen (15/19 = 78.95%) had a FTRD inside the Top-58. Of the twenty-nine non-F4 1-seeds, nineteen (19/29 = 65.5%) had this quality. Though it is only a 13.45% drop-off, not giving your opponent the opportunity to exchange a 50% chance at two points for two 70% chances at one point can be a big difference in a close tournament game in March.
2018 Virginia's Lack of Easy Points
Let's take a simple walk through the Easy Points Approach and see why 2018 UVA had the resume of an upset waiting to happen.
- Tempo: UVA averaged 60.4 possessions per game, which ranks #47/48 among all 1-seeds. This means only one 1-seed since 2008 had fewer scoring opportunities than UVA.
- TOR: UVA averaged 14.1% of possessions with turnovers (#2/48) and forced turnovers on 21% (#16/48) of possessions. With a 6.9% turnover rate margin (21% - 14.1% = 6.9%), UVA generated 4.16 more scoring opportunities per game (6.9% * 60.4) than their opponent, which ranks #5/48 among all 1-seeds {Note: This is not shown in the chart, but it can be calculated for each team following the same calculations made for UVA}. The last three factors will tell us what UVA did with their 64.57 scoring opportunities per game (60.4*6.9% + 60.4 = 64.57).
- EFG%: UVA had a 52.9% EFG%, which is a red flag based on the chart above, and it ranks #28/48 among all 1-seeds. When we dig deeper into the numbers, we see that UVA shot 50% on 2PAs (#44/48) and 39% on 3PAs (#11/48). Looking at the relative ranks, #168 in 2P% in 2018 and #30 in 3P% in 2018 made 2018 UVA #47/48 in 2P% Rank and #17/48 in 3P% Rank. This means 2018 UVA compared to their 2018 field was weaker than the other 1-seeds compared to their respective tournament fields. As stated above, the highest percentage shots are those taken at the rim. When a team makes 50% of the 2PAs, they are either taking lower-percentage 2-pointer jumpers or they are inferior at the rim, neither of which is a good omen. For comparisons, 2018 UVA matches up well with all three shooting percentages of 2011 PITT (although PITT's relative rankings were much better), and 2011 PITT only won one game.
- OR%: UVA had a 27.4% OR%, which was the worst among all 1-seeds. They also ranked 215th compared to their 2018 peers, which also was the worst among all 1-seeds. We already know UVA struggled to shoot the ball, but only rebounding a little more than 1/4th of their missed shots is leaving a lot of easy points off the board. Four 1-seed National Champs had worse shooting percentages than 2018 UVA, but all four rebounded at least 11% more of their misses, even 2011 PITT showed the value of OR% by winning at least one game.
- FTR: When you aren't taking a lot of shots because of slow tempo, when you aren't making a lot of shots because of poor shooting, and when you aren't generating additional shot attempts per scoring opportunity because of low offensive rebounding, then your one saving grace may be easy points at the free throw line. UVA had a FTR of 24.8, also worst among all 1-seeds, and their relative rank of 342 was also worst among 1-seeds. While I continue to discount the importance of the FTR metric, having the worst-ever mark for FTR can't help your cause.
- Summary: 2018 UVA was an entirely one-dimensional team: Boom-or-bust based on defense and their numbers show it. Their offense (or lack-thereof) also was one-dimensional: Live or die by the three-point shot. When a team is littered with this many flaws in their numbers and they face an opponent with nothing to lose, the greatest upset in the history of the tournament doesn't seem like a surprise any more.
Predictive Guidelines
Many of the leading ratings systems had 2018 UVA valued between Top 10 to middle of the pack among the 44 1-seeds from 2008-2018. A breakdown of their numbers using the Four Factors foundation shows they are arguably the worst 1-seed of all-time, let alone the eleven years under scrutiny. This is why I want a ratings system that represents true team quality rather than estimated points spreads or win probabilities versus a generic opponent. As this is a work-in-progress project and no formulas or systems of equations have been developed yet, I will instead provide some predictive guidelines and apply them to the 2020 field.
Barthag: This is Bart Torvik's measure of Pythagorean Win%. No 1-seed with a Barthag relative rank worse than seven has ever made it to the F4. Intuitively, a Barthag of 9 or higher implies the team should be no higher than a 3-seed, and in my work, over-seeds of two seed lines or greater usually has the markings of a potential upset-victim or at least seed-expectation under-achievement.
EFG%: This is the most important factor in advanced metrics, but there isn't any reliable threshold that guarantees a specific level of success or failure. I did find one pattern that increases the probability of under-performance. If a team's EFG% relative rank is better than its AdjOE relative rank (likewise for EFGD% and AdjDE), then the probability of underachievement exists. Since AdjOE and AdjDE account for quality of opponent, the inversion of the relative ranks may imply the team achieved elite-level raw values against inferior competition. Only two 1-seeds achieved champion status with the disqualifier whereas ten fell short.

TOR: The importance of turnovers in relation to scoring opportunities is evident. Only two 1-seeds have reached the F4 with a TOR% relative rank higher than 100. If a 1-seed has a TOR% relative rank higher than 52, then they need to meet the exception to the rule: A Top-16 or better TORD relative rank and a TOR% differential (TORD% - TOR%) greater than or equal to 4.1%.

ORB: Offensive rebounds are also important to getting easy points. Only five 1-seeds to reach the F4 had a 100+ relative rank in OR%. These five teams either had one of two exceptions:
- ORBA rank < 80 and a Top 8 relative rank in either 2P% or 3P%
- ORBA rank > 80 and a Top 15 relative rank in both 2P% and 3P%.

FTRD: Since it was stated above that there is no discernible pattern in FTR, FTRD was a more reliable factor for prediction, but it may not even cross-off very many pretenders. Only three 1-seeds have made the F4 with FTRD rank higher than 80. These three teams had something in common that the four pretenders did not: A TORD relative rank less than or equal to 75. If a team is forcing a high turnover percentage on their opponents, they are probably engaging in more aggressive defense, which is why they allow more free throw attempts. If they are not forcing turnovers at a high rate, then their fouling may be the result of either lazy defense or undisciplined defense.

So, how does this year's crop of potential 1-seeds fare in submission to these guidelines? Since the Selection Committee released an early look at the pod teams last Sunday, we'll use the Top 10 teams to test our guidelines.
Anything can change in the next month, but these are the most likely candidates for 1-seeds on Selection Sunday. If they do not receive a 1-seed, then the guidelines do not apply. Let's see how they will fare against our guidelines assuming the team gets a 1-seed.
- Barthag: Team must have seven or better Barthag ranking. Fails: LOU, WVU, MARY, FLST
- EFG%: Team must have EFG% rank less than AdjOE rank and EFGD% less than AdjDE rank to show that their shooting percentage and shooting defense is not inflated by weak competition. Fails: DAY on offense, LOU on defense, SDST on both. Note: This one seeks National Championship worthiness and it is not a guaranteed pass/fail guideline.
- TOR: Team must have TOR rank better than 100 or meet the exception. Teams that fail are likely to fail seed expectations of a F4 appearance. GONZ, SDST, LOU and MARY pass the rule, FLST passes the exception. Fails: KU, BAY, DUKE, DAY, and WVU, although BAY and DUKE are not far from passing the exception.
- ORB: Team must have ORB rank less than 100 or meet one of the two exceptions: Teams that fail are likely to fail seed expectations of a F4 appearance, but I would heed caution to my readers given the decline of offensive rebounding over the last two decades in college basketball. Fails: DAY and SDST, but both are close to meeting either of the two exceptions.
- FTRD: Team must have FTRD < 100 or meet the exception. Teams that fail are likely to fail seed expectations of a F4 appearance. KU, BAY, GONZ, LOU and MARY pass the rule, and DUKE, SDST, WVU, and FLST pass the exception. Fails: DAY
You are a great asset to college basketball. Your analysis and stats are amazing. Thank You.
ReplyDeleteI appreciate your sentiments and your following of my work, so thank you too!
Delete